Back to Blog

Tableau + Wordsmith = Visualizations Clearly Explained

Today, we’re pleased to announce a game-changing integration between our Wordsmith natural language generation API and Tableau’s web dashboards. This release brings our automated, written explanations side-by-side with Tableau’s beautiful data visualizations in real time.

Companies depend on Tableau’s visualizations to understand their business, but it can be hard to quickly understand what is going on within the data. Some charts have too much data, so you can’t easily separate the signal from the noise. Others require viewing many charts together to understand a trend.

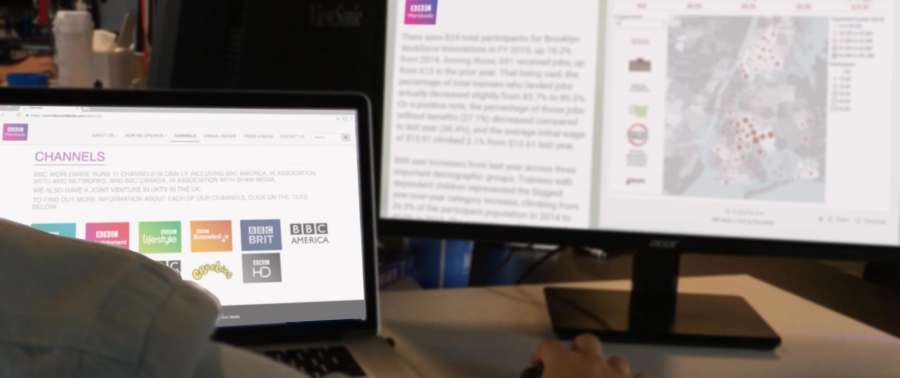
“The natural language capabilities of Wordsmith will be a fantastic addition to our dashboards,” said David Boyle, Executive Vice President Insight at BBC Worldwide. “It will allow us to get more people using data to make more decisions by cutting to the chase and telling people what they need to know, rather than relying on them to work it out by interpreting charts.”

Companies like BBC Worldwide often rely on data experts to write report summaries. These employees’ expertise could be better utilized performing high-value analysis. Companies that don’t have experts available to write this commentary, or enough time to write it, leave employees and executives wasting time interpreting dashboards.

It will allow us to get more people using data to make more decisions by cutting to the chase and telling people what they need to know

David Boyle
Executive Vice President Insight at BBC Worldwide

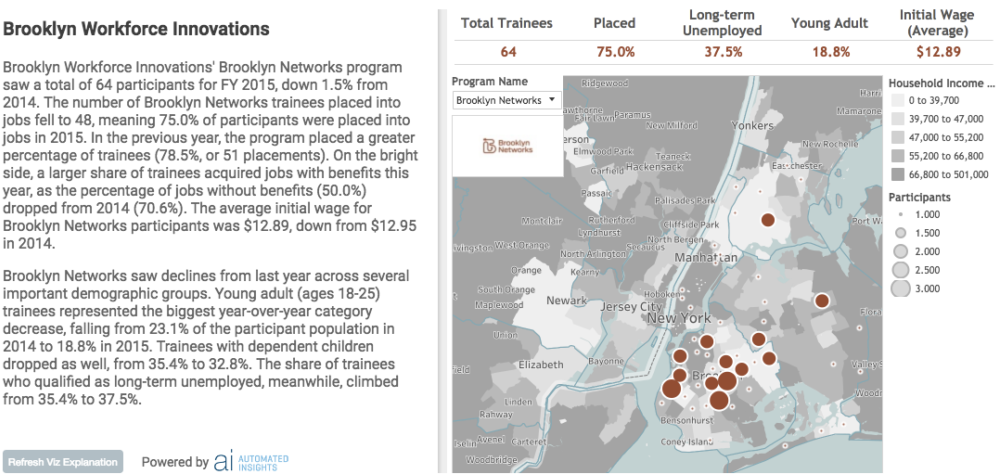
Today, Automated Insights and Tableau are addressing these problems with the release of an integration between Wordsmith’s natural language generation API and Tableau’s getData() API for web dashboards. For the first time, your team’s best data experts can design a template that automatically explains what’s happening in a dashboard. Executives get a concise explanation of events, while the experts move on to higher-value analysis.

Tableau visualization with Wordsmith NLG explanation
As users explore Tableau visualizations and the data changes, the Wordsmith explanation of the data updates in real time, ensuring faster and smarter decisions. Wordsmith narratives can also explain data that’s not visible in the chart.

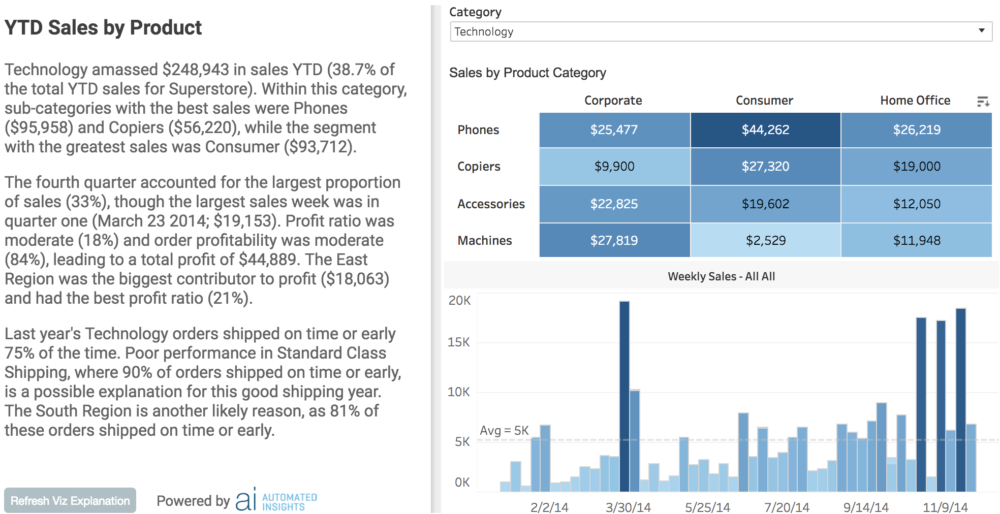
Tableau users can tailor the template to reveal what executives care about, using the company or industry’s voice and language. Since the narratives capture the expertise of your team, you get specific cause-and-effect understanding of all charts in a complex dashboard, rather than the generic, out-of-context description of a single chart given by other natural language generation providers.

Tableau visualization with Wordsmith NLG explanation
Wordsmith explanations of Tableau visualizations are fully customizable and provide clear, insightful context for the data. They convey your best analysts’ expertise and insights using your company’s language. It’s like having an expert speak directly to every user, telling them what the data means.

“The new developer APIs in Tableau 10 have made it possible for partners to extend the possibilities with Tableau,” said Francois Ajenstat, Chief Product Officer at Tableau. “Automated Insights is bringing the power of NLG to Tableau, making data, charts and dashboards more accessible to more people and providing a faster path to insights for our customers.”

Because Wordsmith has the world’s only open API for natural language generation, Tableau customers can start adding commentary to their dashboards right now with a free trial. Paid plans start at just $250 a month. Or, if your team doesn’t have data analysts available, Automated Insights’ team of data scientists can build an automated commentary of your Tableau visualization for you.

“We have already helped some of our Fortune 100 customers build narratives around their Tableau dashboards,” said Adam Smith, Chief Revenue Officer at Automated Insights. “This new integration with Tableau 10 gives our customers the option of building their own custom explanations using the Tableau and Wordsmith APIs.”

To see Wordsmith and Tableau in action together and to get a demo, visit https://automatedinsights.com/tableau.

Check Out Other Wordsmith Integrations

Cookie Permissions
You can select which categories of cookies your computer stores. Click the YES/NO toggles below to turn each category of cookie on and off. Click Save and Accept when you are done. For a full list of cookies in each category, visit our Privacy Policy page